×

UPSC Courses

DNA banner

DAILY NEWS ANALYSIS

  • 16 June, 2020

  • 7 Min Read

INDIA’S FOREIGN TRADE: May2020 - Foreign trade policy

INDIA’S FOREIGN TRADE: May 2020

Part of: GS-III- Economic Data (PT-MAINS-PERSONALITY TEST)

India’s overall exports (Merchandise and Services combined) in April-May2020-21* are estimated to be USD 61.57billion, exhibiting a negative growth of (-) 33.66 per cent over the same period last year. Overall imports in April-May 2020-21* are estimated to be USD 57.19 billion, exhibiting a negative growth of (-) 48.31per cent over the same period last year.

The data for May 2020 is estimation, which will be revised based on RBI’s subsequent release

MERCHANDISE TRADE

EXPORTS (including re-exports)

  • Exports inMay2020 were USD19.05billion, as compared to USD29.99billion in May 2019, exhibiting a negative growth of (-) 36.47per cent. In Rupee terms, exports were Rs. 1,44,166.01crore in May2020, as compared to Rs. 2,09,280.62crore in May2019, registering a negative growth of (-) 31.11per cent.
  • Except for Iron ore, Drugs & pharmaceuticals, Spices and Rice which registered a growth of 103.04%, 17.32%,10.55% and 7.64% respectively, all other commodity/commodity groups have registered negative growth in May 2020 vis-a-vis May 2019.
  • Major commodity groups which have recorded negative growth during May 2020 vis-à-vis May 2019 are Leather & leather products (-75.07%), Handicrafts excl. handmade carpet(-72.77%), Gems & jewellery (-68.83%), Petroleum products (-68.46%), RMG of all Textiles (-66.19%), Jute mfg. including floor covering (-65.7%), Man-made yarn/fabs./made-ups etc. (-58.63%), Meat, dairy & poultry products (-56.38%), Other cereals (-49.53%), Cotton yarn/fabs./made-ups, handloom products etc. (-47.47%), Carpet (-46.18%), Electronic goods (-45.35%), Mica, Coal & other ores, minerals including processed minerals (-35.57%), Ceramic products & glassware (-33.48%), Cashew (-32.86%), Tea (-26.94%), Engineering goods (-24.25%), Oil Meals (-22.76%), Oil seeds (-18.41%), Marine products (-18.14%), Cereal preparations & miscellaneous processed items (-17.44%), Tobacco (-13.75%), Organic & inorganic chemicals (-12.71%), Plastic & Linoleum (-6.55%), Coffee (-5.71%) and Fruits & vegetables (-1.31%).
  • Cumulative value of exports for the period April-May 2020-21 was USD29.41 billion (Rs.2,23,117.42crore) as against USD56.07billion (Rs.3,90,301.96crore) during the period April-May 2019-20, registering a negative growth of (-)47.54per cent in Dollar terms (negative growth of (-)42.83per cent in Rupee terms).
  • Non-petroleum and Non-Gems and Jewellery exports in May 2020 were USD16.36billion, as compared to USD21.42billion in May2019, exhibiting a negative growth of (-) 23.61per cent. Non-petroleum and Non-Gems and Jewellery exports in April-May 2020-21 were USD25.44billion, as compared to USD40.96billion for the corresponding period in 2019-20, a decrease of (-) 37.89 per cent.

IMPORTS

  • Imports in May2020 were USD22.20billion (Rs.1,67,977.68crore), which was 51.05per cent lower in Dollar terms and 46.92per cent lower in Rupee terms over imports of USD45.35billion (Rs3,16,448.93 crore) in May2019. Cumulative value of imports for the period April-May 2020-21 was USD39.32 billion (Rs.2,98,502.76crore), as against USD86.75billion (Rs.6,03,881.86crore) during the period April-May 2019-20, registering a negative growth of (-)54.67per cent in Dollar terms (negative growth of (-)50.57per cent in Rupee terms).
  • Major commodity groups of import showing negative growth in May2020 over the corresponding month of last year are:

CRUDE OIL AND NON-OIL IMPORTS:

  • Oil imports inMay2020 were USD3.49 billion (Rs. 26,380.50crore), which was 71.98percentlower in Dollar terms (69.62percent lower in Rupee terms), compared to USD12.44billion (Rs. 86,822.36crore) in May2019. Oil imports in April-May 2020-21 were USD8.15 billion (Rs. 61,917.72crore) which was 65.79per cent lower in Dollar terms (62.66percent lower in Rupee terms) compared to USD23.82billion (Rs. 1,65,811.82crore), over the same period last year.
  • In this connection it is mentioned that the global Brent price ($/bbl) has decreased by 56.02% in May2020 vis-à-vis May2019 as per data available from World Bank.
  • Non-oil imports inMay2020 were estimated at USD18.71 billion (Rs. 1,41,597.18crore) which was 43.13per cent lower in Dollar terms (38.34percent lower in Rupee terms), compared to USD32.91billion (Rs. 2,29,626.57crore) in May2019. Non-oil imports in April-May 2020-21 were USD31.17billion (Rs. 2,36,585.04crore) which was 50.46per cent lower in Dollar terms (45.99percent lower in Rupee terms), compared to USD62.93billion (Rs. 4,38,070.04crore) in April-May2019-20.
  • Non-Oil and Non-Gold imports wereUSD64billion in May2020, recording a negative growth of (-)33.74per cent, as compared to Non-Oil and Non-Gold imports of USD 28.13billion in May2019. Non-Oil and Non-Gold imports wereUSD31.10billion in April-May 2020-21, recording a negative growth of (-)42.61per cent, as compared to Non-Oil and Non-Gold imports USD 54.18billion in April-May 2019-20.

TRADE IN SERVICES

EXPORTS (Receipts)

  • As per the latest press release by RBI dated 15thJune 2020, exports in April2020 were USD 16.45 billion (Rs. 125,409.04 crore) registering a negative growth of (-) 8.92 per cent in dollar terms, vis-à-vis April2019. The estimated value of services export for May2020* is USD 15.70 billion.

IMPORTS (Payments)

  • As per the latest press release by RBI dated 15th June 2020, imports in April 2020 were USD 9.30 billion (Rs. 70,907.57crore) registering a negative growth of (-)18.43 per cent in dollar terms, vis-à-vis April2019. The estimated value of service import for May2020* is USD 8.57 billion.

III.TRADE BALANCE

  • MERCHANDISE: The trade deficit for May2020 was estimated at USD3.15billion as against the deficit of USD15.36billion inMay2019.
  • SERVICES: As per RBI’s Press Release dated 15th June 2020, the trade balance in Services (i.e. Net Services export) for April 2020 is estimated at USD7.15 billion.
  • OVERALL TRADE BALANCE: Taking merchandise and services together, overall trade surplus for April-May 2020-21* is estimated at USD4.37 billion as compared to the deficit of USD17.84 billion in April-May 2019-20.

Foreign Trade Policy 2015-20

The Union Commerce and Industry Ministry has announced changes in India’s Foreign Trade Policy (FTP). The Govt. has decided to continue relief under various export promotion schemes by granting an extension of the existing Policy.

  • It provided a framework for increasing exports of goods and services as well as generation of employment and increasing value addition in the country, in keeping with the “Make in India” vision of Prime Minister.
  • The focus of the new policy is to support both the manufacturing and services sectors, with a special emphasis on improving the ‘ease of doing business’.
  • It described the market and product strategy and measures required for trade promotion, infrastructure development and overall enhancement of the trade ecosystem.

Features of the FTP

  • Goods – Earlier there were 5 different schemes (Focus Product Scheme, Market Linked Focus Product Scheme, Focus Market Scheme, Agri. Infrastructure Incentive Scrip, VKGUY) for rewarding merchandise exports with different kinds of duty scrips with varying conditions attached to their use.
  • Duty-free scrips are paper authorisations that allow the holder to import inputs which are used to manufacture products that are exported, or to manufacture machinery used for producing such goods, without paying duty equivalent to the printed value of the scrip.
  • For instance, a duty-free scrip valued at Rupees 1 lakh allows the holder to import goods without paying duty of up to Rupees 1 lakh on the goods.
  • Under the new Foreign Trade Policy, all these schemes have been merged into a single scheme, namely the Merchandise Export from India Scheme (“MEIS“) and there is no conditionality attached to scrips issued under the MEIS.
  • Services – The Served From India Scheme has been replaced with the Service Exports from India Scheme (“SEIS“).
  • SEIS is stated to apply to ‘Service Providers located in India’ instead of ‘Indian Service Providers’.
  • Therefore, SEIS rewards to all service providers of notified services, who are providing services from India, regardless of the constitution or profile of the service provider.
  • Special Economic Zones – The policy outlines extended incentives for Special Economic Zones in India
  • Export Houses – The nomenclature of Export House, Star Export House, Trading House, Star Trading House, Premier Trading House certificate has been simplified and changed to One, Two, Three, Four and Five Star Export House.
  • Status Holders – Business leaders who have excelled in international trade and have successfully contributed to India’s foreign trade are proposed to be recognized as Status Holders and given special privileges to facilitate their trade transactions, in order to reduce their transaction costs and time.
  • Resolving Complaints – In an effort to resolve quality complaints and trade disputes between exporters and importers, a new chapter on Quality Complaints and Trade Disputes has been incorporated into the Foreign Trade Policy.
  • There would be no conditionality attached to any scrips issued under these schemes.
  • For grant of rewards under MEIS, the countries have been categorized into 3 Groups, whereas the rates of rewards under MEIS range from 2% to 5%.
  • Under SEIS the selected Services would be rewarded at the rates of 3% and 5%.

Source: PIB


India–Azerbaijan

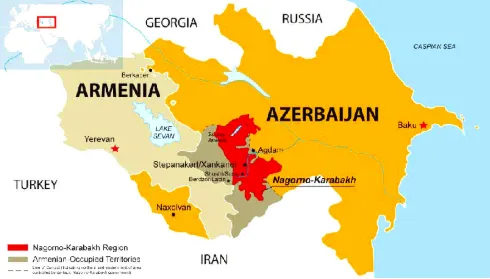
A year after tensions arising from Operation Sindoor, India and Azerbaijan have taken steps to restore and normalise bilateral relations. The 6th round of Foreign Office Consultations, held in Baku, marked the first such engagement since 2022, signaling renewed diplomatic momentum. Recent Diplomatic Engagement During the consultations, bo

India–Australia Economic Cooperation and Trade Agreem

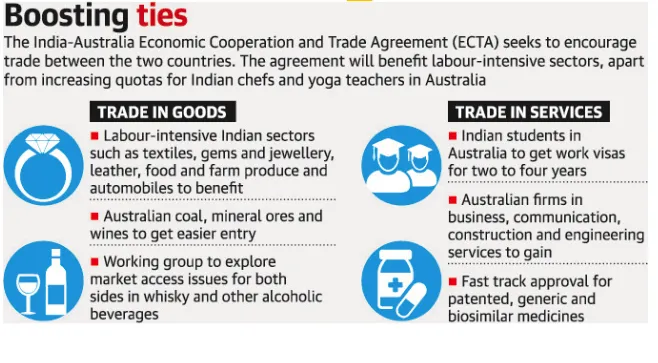
The India–Australia Economic Cooperation and Trade Agreement has completed four years since its signing. Both countries now aim to build on this progress through strengthened collaboration and ambitious targets, including reaching AUD 100 billion in bilateral trade by 2030. What is the India–Australia Economic Cooperation and Tra

ADR Report on Political Funding

A recent report by the Association for Democratic Reforms (ADR) analyses donations of ?20,000 or more declared to the Election Commission of India (ECI) by national political parties for FY 2024–25, highlighting transparency and accountability in political financing. Key Findings Massive Funding Surge Total donations to nationa

Maritime Chokepoints

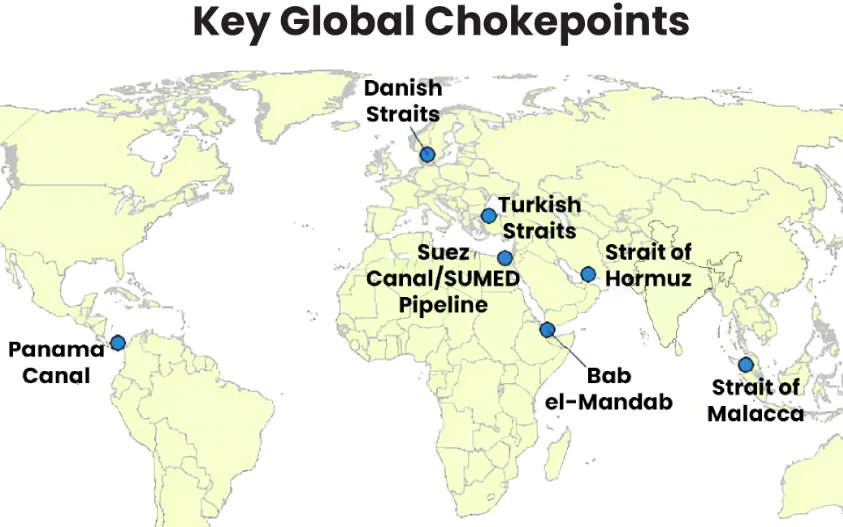
Maritime chokepoints are narrow channels along global shipping routes where maritime traffic is concentrated. These points are geopolitically and economically critical, as they handle a large proportion of global trade, especially energy shipments. Current Relevance Over two-thirds of seaborne energy trade passes through a handful o

US-Israel-Iran War

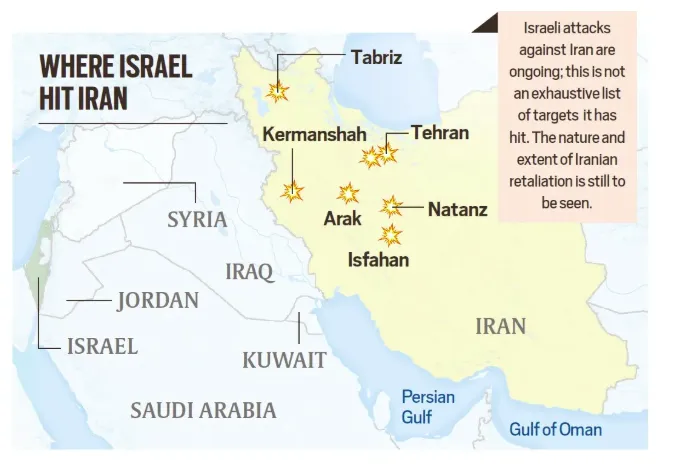
Following the launch of Operation Epic Fury (U.S.) and Operation Roaring Lion (Israel), the geopolitical landscape has shifted fundamentally with the confirmed death of Iran’s Supreme Leader, Ayatollah Ali Khamenei.Iran retaliated through Operation True Promise 4, launching missile attacks against Israel and nearby Gulf states. The escala

DNA

05 Apr,2026

Toppers

Search By Date

Newsletter Subscription
SMS Alerts

Important Links

UPSC GS Mains Crash Course - RAW